We use cookies on this site to enhance your user experience
By clicking the Accept button, you agree to us doing so. More info on our cookie policy
We use cookies on this site to enhance your user experience
By clicking the Accept button, you agree to us doing so. More info on our cookie policy
Published: Jul 1, 2020 by C.S. Rhymes
I started working with the Laravel HTTP client on a recent project and I had the debug bar package installed. I wondered if you could use the Laravel Debugbar to record how many api calls were being made and how long each was taking to run? I reached out to it’s creator, Barry vd. Heuvel, on twitter and the rest is history!
@barryvdh firstly, thanks for the Laravel debugbar! I was wondering if it can be used to track Laravel 7 Http Client requests made in a Controller? Just interested to see how long each request takes.
— C.S. Rhymes (@chrisrhymes) June 23, 2020
This sparked a conversation between Barry and the creator of the Guzzle Debugbar package, Hannes Van De Vreken. It turns out there wasn’t currently a way to tap into the HTTP Client in Laravel 7 so Hannes created a pull request to allow this, which got merged into Laravel 7.18!
So how do you use it?
First start by installing the two packages into your Laravel project.
composer require barryvdh/laravel-debugbar --dev
composer require hannesvdvreken/guzzle-debugbar --dev
Then add the service providers. As I only wanted to use the debugbar for local development I added them to the the AppServiceProvider instead of in the app.php config file.
// app/Providers/AppServiceProvider.php

public function register()
{
    if($this->app->isLocal()) {
        $this->app->register(\Barryvdh\Debugbar\ServiceProvider::class);
        $this->app->register(\GuzzleHttp\Profiling\Debugbar\Support\Laravel\ServiceProvider::class);
    }
}
You may also need to run composer update if you are running an older version of Laravel 7 to get 7.18.
The below code shows an example controller that sends a get request to the jsonplaceholder api and gets an array of users. Following the instructions on the Guzzle Debugbar package and a bit of trial and error I managed to add the profiler middleware to the Laravel HTTP Client.
It took me a while to figure out how to get the results to display in the debugbar. Initially I was setting the $debugbar = new StandardDebugbar(); before I saw a closed issue on the package that explains you need to get the debugbar from the IOC container.
<?php

namespace App\Http\Controllers;

use GuzzleHttp\Profiling\Debugbar\Profiler;
use GuzzleHttp\Profiling\Middleware;
use Illuminate\Support\Facades\App;
use Illuminate\Support\Facades\Http;

class ExampleController extends Controller
{
    public function index()
    {
        $debugbar = App::make('debugbar');
        $timeline = $debugbar->getCollector('time');
        $profiler = new Profiler($timeline);

        $users = Http::withOptions([
                'base_uri' => 'https://jsonplaceholder.typicode.com/'
            ])
            ->withMiddleware(new Middleware($profiler))
            ->get('users')
            ->json();

        return view('example', compact('users'));
    }
}
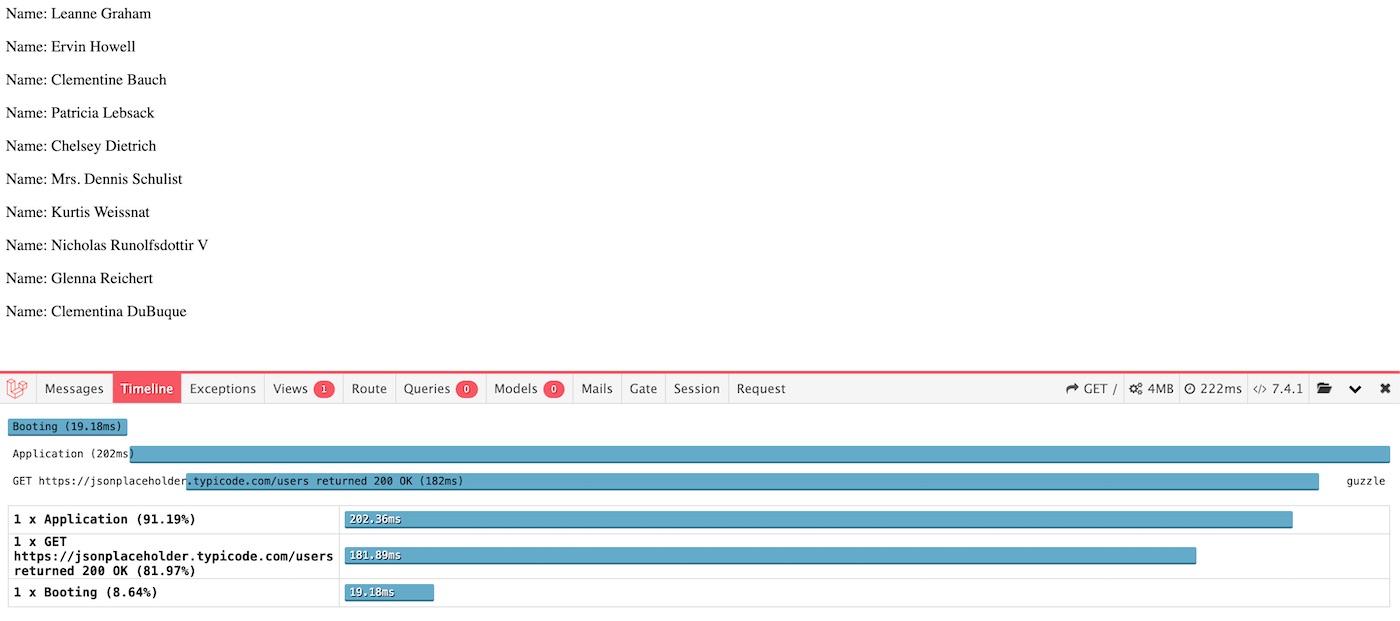
When we load the view we now get the information about the request in the Timeline tab of the debugbar. The get request took 181ms.
If you have many methods in your controller sending requests with the HTTP CLient then it might be better to extract this to the constructor. The below example shows 2 requests to the api where both will be recorded in the timeline tab.
You will also run into problems in production as we set the Laravel Debugbar and Guzzle Debugbar to only be dev dependencies in the composer.json file so you will need to wrap it in a check to only add this functionality if the app env is local.
<?php

namespace App\Http\Controllers;

use GuzzleHttp\Profiling\Debugbar\Profiler;
use GuzzleHttp\Profiling\Middleware;
use Illuminate\Support\Facades\App;
use Illuminate\Support\Facades\Http;

class ExampleController extends Controller
{
    private $http;

    public function __construct()
    {
        $this->http = Http::withOptions([
                'base_uri' => 'https://jsonplaceholder.typicode.com/'
            ]);

        if(App::environment('local')) {
            $debugbar = App::make('debugbar');
            $timeline = $debugbar->getCollector('time');
            $profiler = new Profiler($timeline);
            $this->http->withMiddleware(new Middleware($profiler));
        }
    }

    public function index()
    {
        $users = $this->http
            ->get('users')
            ->json();

        $posts = $this->http
            ->get('posts')
            ->json();

        return view('example', compact('users', 'posts'));
    }
}
Share
Latest Posts

Recently I had the opportunity to work on a new side project. I had already decided I wanted to use Laravel and Livewire, but I wasn’t sure about the frontend user interface. I had seen some demos of Flux UI and liked what I had seen, so decided to give it a try.

I thought I’d share some learnings about how to host a Next.js site with AWS Elastic Beanstalk. This is a minimum configuration to get a basic site up and running.

I’ve seen a few posts recently asking what other authors use for their website. There are many options available, but sometimes you just want a single page with links to your social media profiles and links to your books. This is where Bulma Clean Theme and GitHub pages can come to the rescue.

Unlooked for Tales - a collection of short stories
By C.S. Rhymes
Free on Apple Books and Google Play Books
Nigel's Intranet Adventure
By C.S. Rhymes
From £0.99 or read for free on Kindle Unlimited!